Assignment 7: Working with U.S. Census Data: American Fact Finder and TIGER/Line(R) shapefiles
Problem
Sometimes it is necessary to work with census data in order to gain information on the demographics of an area of interest. Such is the case here where the goal is to create a thematic map that displays a particular attribute from the U.S. Census dataset at a particular geography. The Census data table utilized in this assignment is the “Age Groups and Sex: 2010” table, filtered to only include data for the Hispanic or Latino (of any race) ethnic group by ZCTAs within the state of North Carolina (DEC_10_SF2_QTP1_with_ann). This table summarizes the male, female, and total populations of Hispanic or Latino people for many different age groups in each ZCTA within North Carolina. The name of the attribute field to be mapped is: “SUBHD0101_S06 Number – Both sexes; Total population – 20-24 years”; this field contains the total population of Hispanic or Latino people within the age group of 20-24 years in each North Carolina ZCTA.
Analysis Procedures
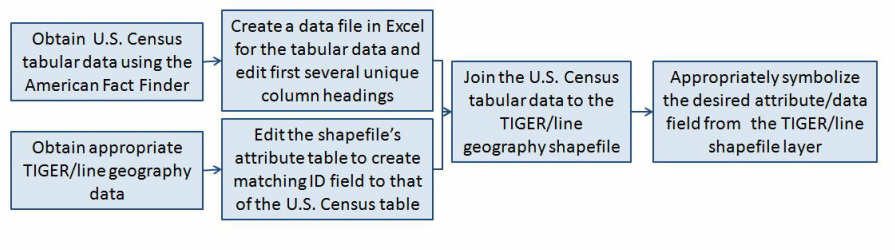
The first step is to obtain the appropriate U.S. Census data and TIGER/Line geography data. To find and select Census data, the American Fact Finder is used. TIGER/Line geography data can be obtained through the U.S. Census or ESRI. It is important to ensure that both of these datasets are from the same Census year (i.e. 2000 or 2010) to preserve accuracy and consistency.
Once the tabular Census data is obtained, it is saved as an Excel workbook so that the first 7 unique column names can be properly edited. Next, a new geoid field is added to the TIGER/Line data’s attribute table and calculated to match the geoid field in the Census data file. We then join the Census table to the TIGER/Line data based on this common geoid field. As a result, the Census data is linked to geography and thus can be represented spatially. Lastly, the attribute/data field of interest is symbolized appropriately (i.e. graduated colors) and mapped.
Sometimes it is necessary to work with census data in order to gain information on the demographics of an area of interest. Such is the case here where the goal is to create a thematic map that displays a particular attribute from the U.S. Census dataset at a particular geography. The Census data table utilized in this assignment is the “Age Groups and Sex: 2010” table, filtered to only include data for the Hispanic or Latino (of any race) ethnic group by ZCTAs within the state of North Carolina (DEC_10_SF2_QTP1_with_ann). This table summarizes the male, female, and total populations of Hispanic or Latino people for many different age groups in each ZCTA within North Carolina. The name of the attribute field to be mapped is: “SUBHD0101_S06 Number – Both sexes; Total population – 20-24 years”; this field contains the total population of Hispanic or Latino people within the age group of 20-24 years in each North Carolina ZCTA.
Analysis Procedures
The first step is to obtain the appropriate U.S. Census data and TIGER/Line geography data. To find and select Census data, the American Fact Finder is used. TIGER/Line geography data can be obtained through the U.S. Census or ESRI. It is important to ensure that both of these datasets are from the same Census year (i.e. 2000 or 2010) to preserve accuracy and consistency.
Once the tabular Census data is obtained, it is saved as an Excel workbook so that the first 7 unique column names can be properly edited. Next, a new geoid field is added to the TIGER/Line data’s attribute table and calculated to match the geoid field in the Census data file. We then join the Census table to the TIGER/Line data based on this common geoid field. As a result, the Census data is linked to geography and thus can be represented spatially. Lastly, the attribute/data field of interest is symbolized appropriately (i.e. graduated colors) and mapped.
Results
The following map shows the resulting thematic map, displaying a particular attribute from the U.S. Census dataset (total Hispanic/Latino population within the ages of 20 and 24) by ZCTA for a particular geography (North Carolina). Thus, this map provides insight into the distribution of young Hispanic/Latino adults throughout the state of North Carolina. These results may be of interest to someone researching Hispanic/Latino demographics in the state of North Carolina.
The following map shows the resulting thematic map, displaying a particular attribute from the U.S. Census dataset (total Hispanic/Latino population within the ages of 20 and 24) by ZCTA for a particular geography (North Carolina). Thus, this map provides insight into the distribution of young Hispanic/Latino adults throughout the state of North Carolina. These results may be of interest to someone researching Hispanic/Latino demographics in the state of North Carolina.

Application and Reflection
The U.S. Census database is a very large database containing a plethora of detailed information on people and their demographics. This is a good thing because U.S. Census data (in combination with TIGER/Line data) can be used to create a lot of very useful and beneficial new, spatial information. Its applications are endless. For example, businesses and markets can identify the distribution of particular people groups on which they want to focus their services (i.e. middle-aged people, Asian-Americans, people living in households of 6 people or more, etc.); social workers and/or non-profit organizations interested in assisting the needy can locate people with very specific living conditions and incomes; city authorities can quantify the diversity of people in their city; employers can locate unemployed people; state governments can identify trends in education, such as school enrollment, etc. And this is only the tip of the iceberg. In general, all kinds of people, organizations, and entities can benefit from U.S Census data used in tandem with TIGER/Line shapefiles as they manipulate it to fit their specific needs.
The U.S. Census database is a very large database containing a plethora of detailed information on people and their demographics. This is a good thing because U.S. Census data (in combination with TIGER/Line data) can be used to create a lot of very useful and beneficial new, spatial information. Its applications are endless. For example, businesses and markets can identify the distribution of particular people groups on which they want to focus their services (i.e. middle-aged people, Asian-Americans, people living in households of 6 people or more, etc.); social workers and/or non-profit organizations interested in assisting the needy can locate people with very specific living conditions and incomes; city authorities can quantify the diversity of people in their city; employers can locate unemployed people; state governments can identify trends in education, such as school enrollment, etc. And this is only the tip of the iceberg. In general, all kinds of people, organizations, and entities can benefit from U.S Census data used in tandem with TIGER/Line shapefiles as they manipulate it to fit their specific needs.
