Basics of Data and Information
Problem
The geographic world is very complex. To better understand it, we can utilize and manipulate geographic data to represent and/or describe it. However, geographic data is intrinsically imperfect due to the inherent complexity of the geographic world--it is limited in its ability to reflect reality. This may be due to the way the data was collected, digitized, and/or converted to different formats. Consequently, this leaves us with the task of seeking to understand the integrity of the imperfect geographic data we have as well as making the most out of it through proper analysis methods. The end goal is to obtain geographic information that is as true to reality as possible and therefore, meaningful.
Analysis Procedures
The following analyses demonstrate different ways to manipulate geographic data and obtain new information.
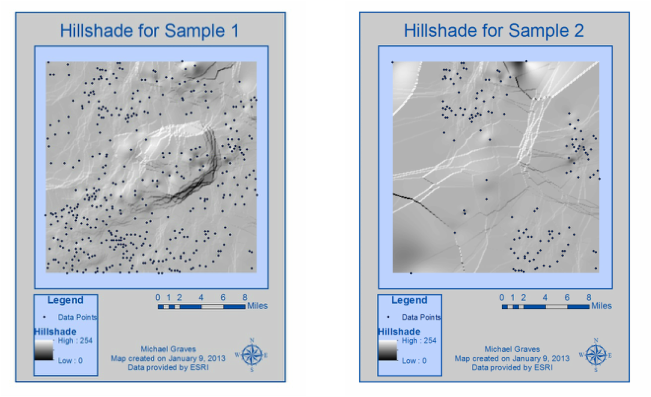
First of all, we examine the differences in the interpolation results between 2 different sets of elevation data points. The first data set contains data points that are roughly spread out evenly across the area of interest while in the second data set, the overall distribution of data points is not representative of the area of interest as a whole. To analyze the differences between these samples, we interpolate the elevation of each using the Inverse Distance Weighted (IDW) interpolation method and then compute the hillshade for each interpolation result.
The geographic world is very complex. To better understand it, we can utilize and manipulate geographic data to represent and/or describe it. However, geographic data is intrinsically imperfect due to the inherent complexity of the geographic world--it is limited in its ability to reflect reality. This may be due to the way the data was collected, digitized, and/or converted to different formats. Consequently, this leaves us with the task of seeking to understand the integrity of the imperfect geographic data we have as well as making the most out of it through proper analysis methods. The end goal is to obtain geographic information that is as true to reality as possible and therefore, meaningful.
Analysis Procedures
The following analyses demonstrate different ways to manipulate geographic data and obtain new information.
First of all, we examine the differences in the interpolation results between 2 different sets of elevation data points. The first data set contains data points that are roughly spread out evenly across the area of interest while in the second data set, the overall distribution of data points is not representative of the area of interest as a whole. To analyze the differences between these samples, we interpolate the elevation of each using the Inverse Distance Weighted (IDW) interpolation method and then compute the hillshade for each interpolation result.

We also perform a spatial analysis to determine a suitable location for a new coffee shop. To solve this problem, many factors need to be considered, but only proximity to preexisting coffee shops and spending density are taken into account here. For a location to be appropriate for a new coffee shop, it must be more than a mile away from preexisting coffee shops to avoid competition (Euclidean Distance) and it must lie in an area with a spending density greater than 20,000 to ensure good business (Kernel Density). Both of these criteria are combined using map algebra to yield ideal locations for a new coffee shop.
Results
The following 2 maps represent the hillshade for the first data set and the second data set, respectively. It is clear that the second data set does not resolve the main elevated feature in the right-center of the area. This is due to the lack of observations/data points over that area in the second sample. Therefore, sample 2 is a poor set of data points and should be scrapped. Overall, this exercise demonstrates how the manner in which data is collected is very important.
Below is a map of the best locations for a new coffee shop based on the distance and density criteria.

Application and Reflection
A geographic information system (GIS) is a powerful tool that takes geographic data, manipulates it, and yields useful geographic information which can then be applied to reality. As a result, geographic data plays an integral part in gaining geographic information. Overall, these examples demonstrate that geographic data is very useful for obtaining geographic information through spatial analysis, as long as the data itself is properly collected, digitized, etc. to minimize inaccuracies. Unfortunately, we cannot avoid the inherent uncertainties within the data, but we can often identify them and thus, interpret the results accordingly and properly.
An example of a spatial analysis problem that can be taken much further than the coffee shop example is one that accounts for many factors, rather than just 2 criteria, and/or includes different types of data (i.e. both vector and raster data). For instance, consider an analysis seeking to identify flood prone areas within a particular county. To solve this problem, one needs to take into account the slope of the terrain, soil type of the terrain, land use and vegetation throughout the area, precipitation climatology over the area, etc. All of these criteria are then consolidated into one analysis to produce a result that hopefully reflects reality.
