Assignment 6: Database Cardinality Issues in ArcGIS
Problem
We are tasked with providing each North Carolina state senate and house member with the number of jobs created in their own district as well as the number of jobs created in the surrounding districts. This information must be mapped to be effectively conveyed.
Analysis and Procedures
Given data include house district and senate district polygon shapefiles, a zip code point layer, and a table containing job creation survey results.
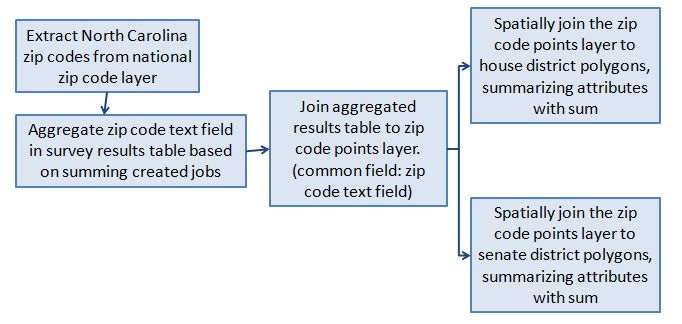
Initially, the zip code points in North Carolina are extracted from the zip code dataset, since the dataset contains zip code information for the whole continental U.S. The first step in solving the problem at hand is to aggregate the zip code text field in the survey results table through summing up the created jobs in each zip code. This results in a new table containing information only on the zip codes and the total number of created jobs in each. This table is then joined to the North Carolina zip code point layer in order to associate the created jobs data with the zip code points. The common field on which this tabular join is based is the zip code text field. Next, the North Carolina zip code point layer is joined to the house and senate district polygon layers through spatial joins that sum up the created jobs in each district polygon.
We are tasked with providing each North Carolina state senate and house member with the number of jobs created in their own district as well as the number of jobs created in the surrounding districts. This information must be mapped to be effectively conveyed.
Analysis and Procedures
Given data include house district and senate district polygon shapefiles, a zip code point layer, and a table containing job creation survey results.
Initially, the zip code points in North Carolina are extracted from the zip code dataset, since the dataset contains zip code information for the whole continental U.S. The first step in solving the problem at hand is to aggregate the zip code text field in the survey results table through summing up the created jobs in each zip code. This results in a new table containing information only on the zip codes and the total number of created jobs in each. This table is then joined to the North Carolina zip code point layer in order to associate the created jobs data with the zip code points. The common field on which this tabular join is based is the zip code text field. Next, the North Carolina zip code point layer is joined to the house and senate district polygon layers through spatial joins that sum up the created jobs in each district polygon.
Results
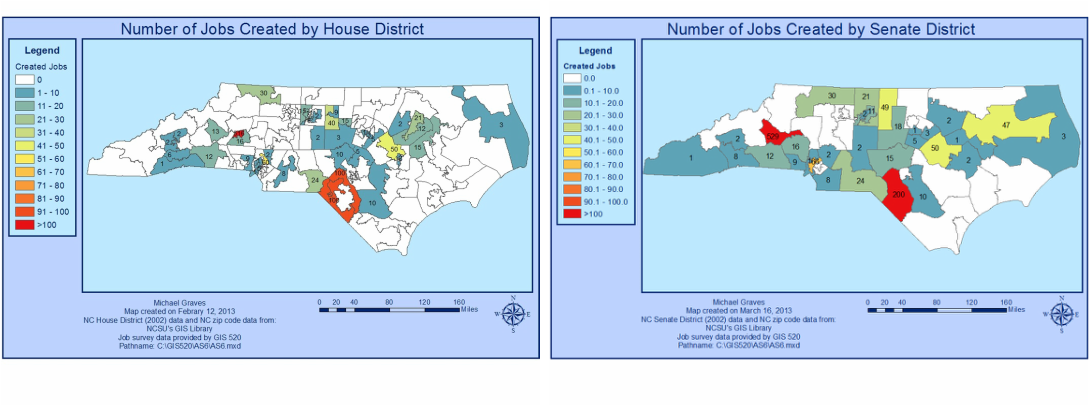
The two maps below show the results for the number of jobs created in every NC house district and every NC senate district, respectively. In general, both maps are consistent with one another regarding the locations where jobs were created and the the amount of jobs created in those locations.
The two maps below show the results for the number of jobs created in every NC house district and every NC senate district, respectively. In general, both maps are consistent with one another regarding the locations where jobs were created and the the amount of jobs created in those locations.
Application and Reflection
Tabular and spatial joins are powerful tools because they can enable us to associate tabular, non-spatial data, to spatial data. Consequently, they are another way in which we can create new information from raw data. For example, demographic data is tabular, non-spatial data, but describes characteristics about people that live in a spatial world. Suppose a golf course designer wants to construct a golf course in a county where there are a lot of people over the age of 60 (near retirement age). In essence, all he/she needs is tabular age data that contains zip codes, a counties layer, and a zip code point layer. He/she could then link their target age group (older than 60 years old) to the zip code points and then associate those zip code points with counties to determine how many people older than 60 years old live in each county. These results could then assist the golf course designer in his/her decision process. Overall, the designer took raw data and created new data that was useful.
Tabular and spatial joins are powerful tools because they can enable us to associate tabular, non-spatial data, to spatial data. Consequently, they are another way in which we can create new information from raw data. For example, demographic data is tabular, non-spatial data, but describes characteristics about people that live in a spatial world. Suppose a golf course designer wants to construct a golf course in a county where there are a lot of people over the age of 60 (near retirement age). In essence, all he/she needs is tabular age data that contains zip codes, a counties layer, and a zip code point layer. He/she could then link their target age group (older than 60 years old) to the zip code points and then associate those zip code points with counties to determine how many people older than 60 years old live in each county. These results could then assist the golf course designer in his/her decision process. Overall, the designer took raw data and created new data that was useful.
